The Project Statistics button in Microsoft Project provides a quick and highly useful “status-at-a-glance” snapshot of your construction project's programme. This tool offers an immediate overview of all key information for the project.
It allows you to quickly determine whether the project is on track or if there are issues, such as being over time or over budget.
For the purpose of these instructions, I will be using a blank Microsoft Project file.
The trail for viewing Statistics is:
Project Tab > Properties group > Project Information button > Project Information dialogue box > Statistics
Below you can find instructions on locating your programme's Project Statistics.
1. Select the Project tab, find and click the Project Information button within the Properties group.

Project Tab > Properties group > Project Information button
2. In the Project Information dialogue box, click Statistics.

Project Information dialogue box > Statistics
3. The Project Statistics are illustrated within the following table:

The Statistics tool button can be added to the Quick Access Toolbar, so that is always immediately available without having to navigate back to the Project Information dialogue each time you want to use it. For demonstration purposes, I will be using a blank MS Project file.
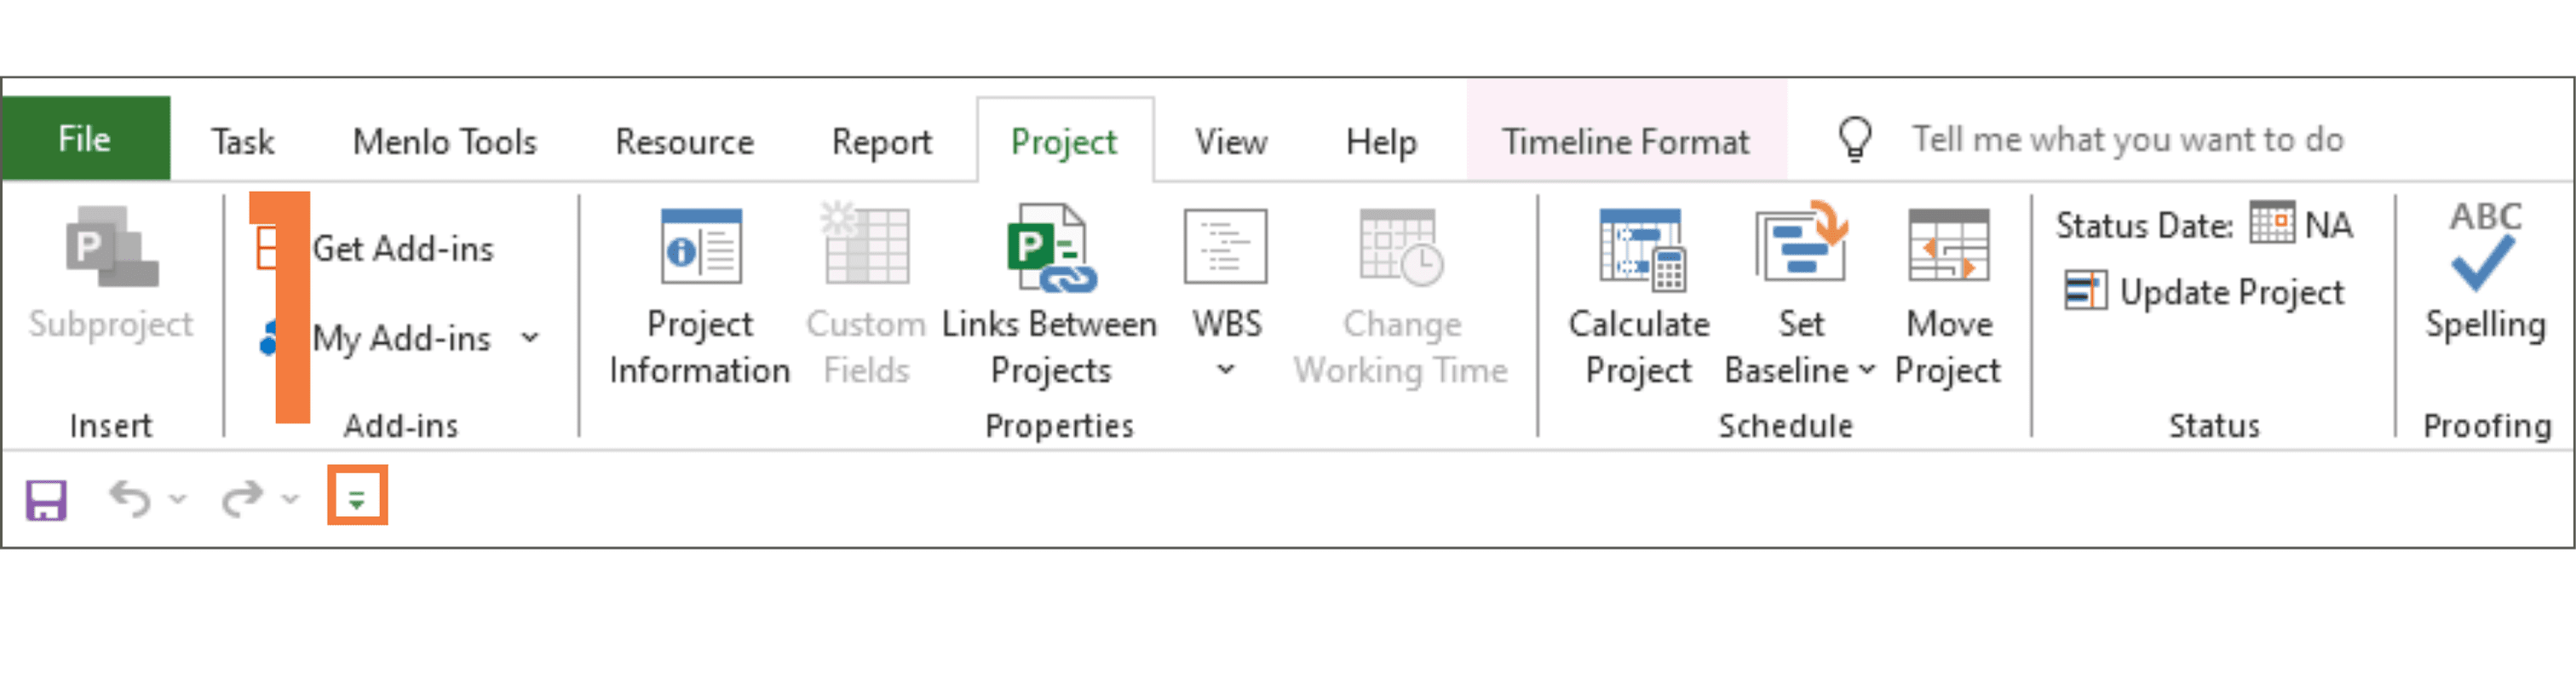
1. To add it to the Toolbar, click on the drop-down arrow icon (pictured right) at the end of the Quick Access Toolbar. You will see a hint that says, 'Customize Quick Access Toolbar'.

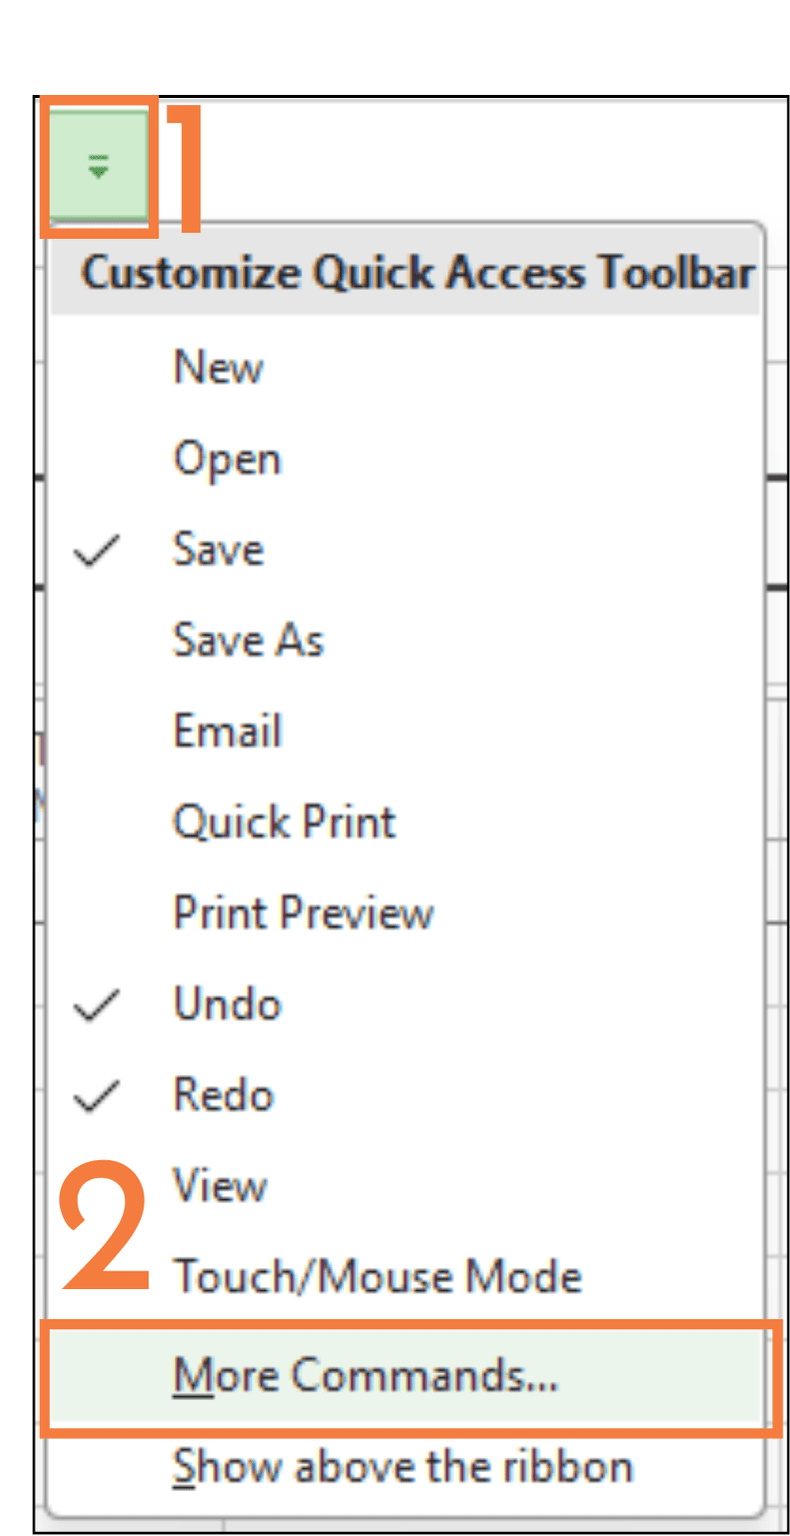
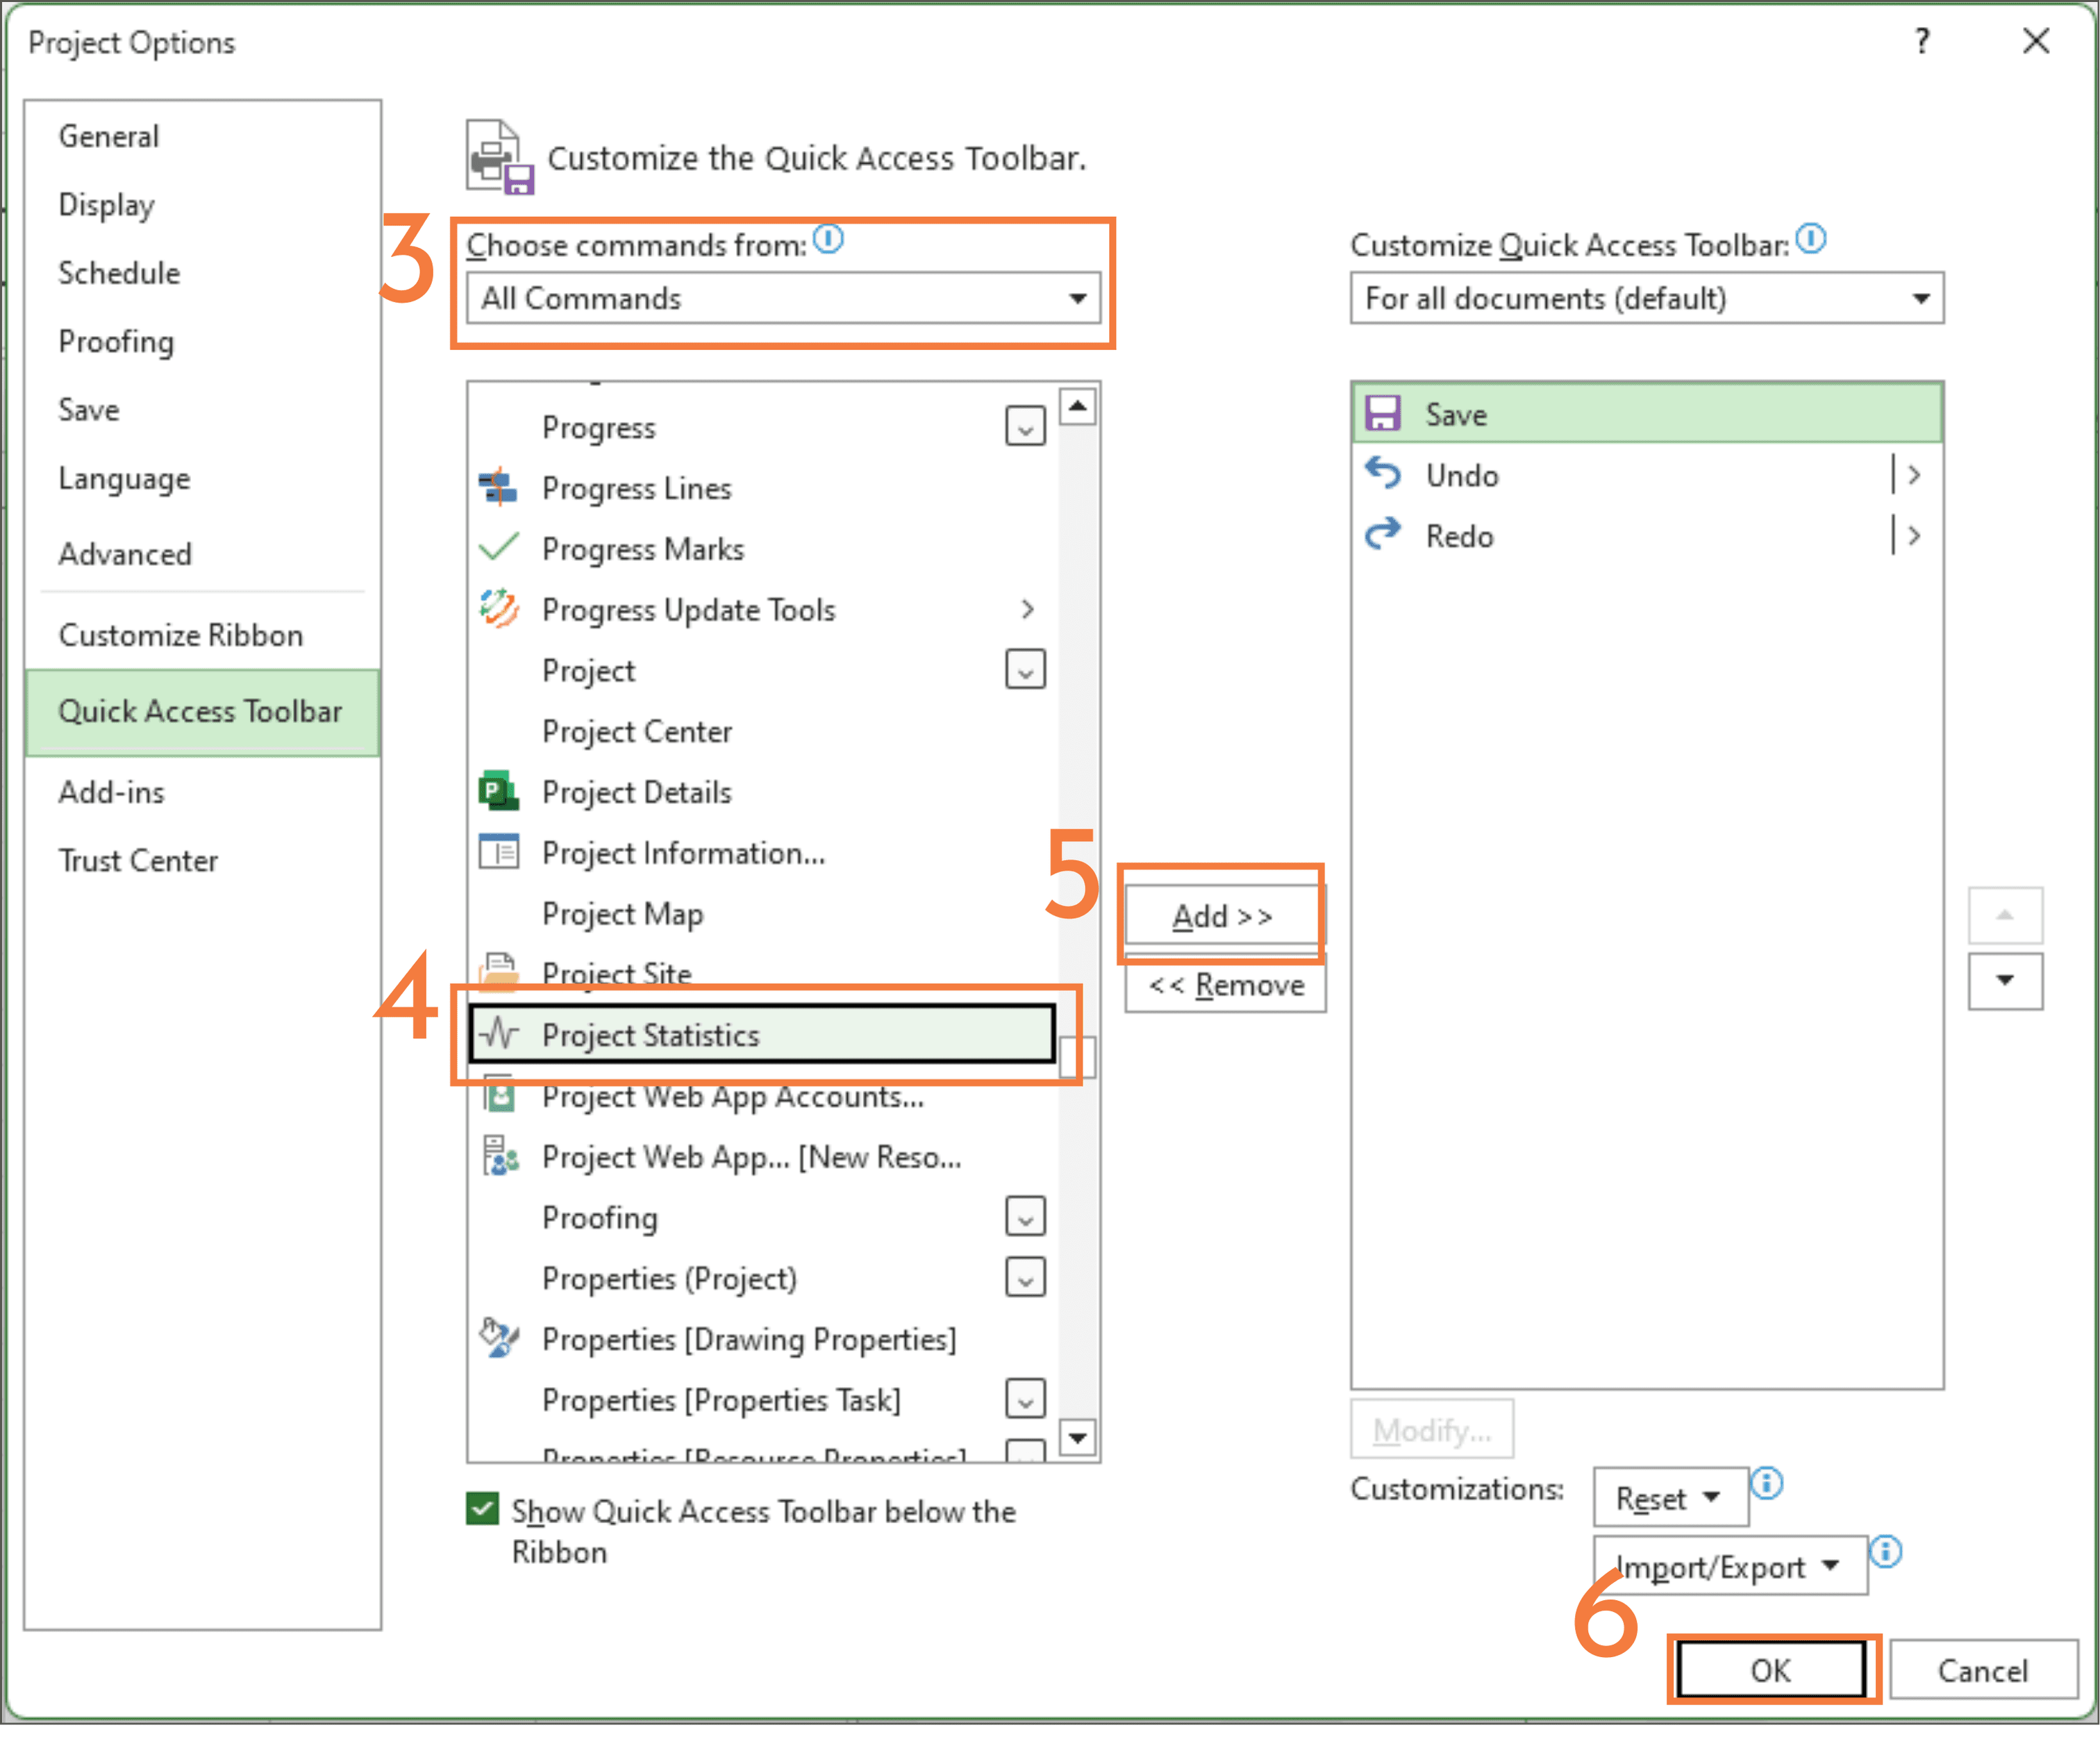
2. Choose More Commands.... This will open the Project Options dialogue box on the Quick Access Toolbar tab.
3. Under Choose commands from:, select All Commands in the drop-down menu.
4. In the list below, scroll to find and select Project Statistics.
5. Click Add >> to customise your Quick Access Toolbar.
6. Click OK to save the change and close the dialogue box.
7. The Statistics button is now loaded on the Toolbar:

Note: The Quick Access Toolbar may appear above the ribbon depending on your settings.

To move the Toolbar above the ribbon, select the Show above the ribbon option in the Customize Quick Access Toolbar drop-down menu. This is one of the many ways in which you can customise Microsoft Project to suit your needs and preferences.
You can add the Project Statistics button as a quick check for effect on Critical Path when adding delays and changes in scope to the programme.
Check out our video on the Project Statistics Tool below:
If you have any questions regarding MS Project, or construction programming, feel free to email at JustAsk@Menlo-Academy.com.
Setting up and inserting a Logo into the Print of a Programme is easy. When you are in Print Preview, go into the Page Setup dialogue, and choose either the Header or Footer Tab
The Logo can be positioned in one or more of 6 positions on the printout of your programme. These are Header Left, Centre & Right and then correspondingly, Left, Centre & Right in the Footer.
The question though is how to size the Logo to suit your need, as they don’t always come in exactly the right size for your purposes.
So, let’s run through an example.
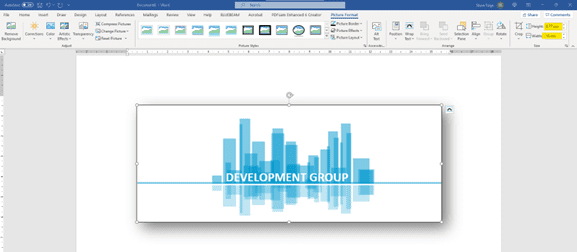
Below is a screenshot of the Logo I want to insert into the programme, pasted into word. I’ve put the border and shadow on it to make it easy to see the size and extent of the graphic. What you can see in relation to the width of the A4 page is actually pretty close to actual size of the graphic. Sometimes they may be much larger. The Size is highlighted in yellow at top right of the screen.
When you insert a graphic into the header or footer of the programme, either by clicking the insert image button on the page set up dialogue, and then navigating to the image file. Use either a .png or .jpg file.
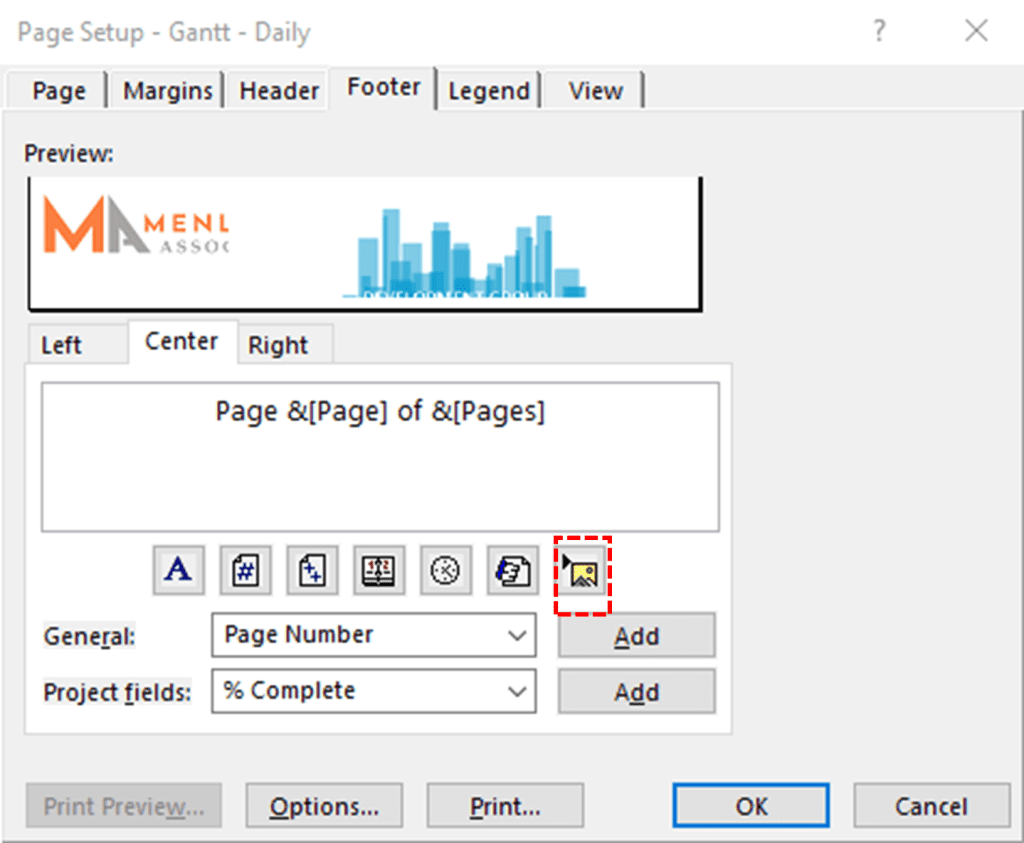
Or by just copying and pasting into the section you want it to appear in. It will insert at the image's full size.
Ideally you want the Logo to be about 25mm (1 inch) maximum. You can either reduce the size of the Logo in Word and then copy and paste directly at the smaller size, or you can adjust the Logo in Project to the size you want. Either way you are going to want to keep a copy of the correct sized Logo for future use
I’m going to demonstrate using an over-sized image that we reduce to fit our required size and then save for re-use in other programmes.
The screenshot below is showing the result of copying & pasting the graphic into place straight from the Word document above. It’s oversized but not too bad. If it’s too large, you may have to drag it smaller in Word first as that will make it much easier to handle in Project. You have to work in a very small window in the Project dialogue box.
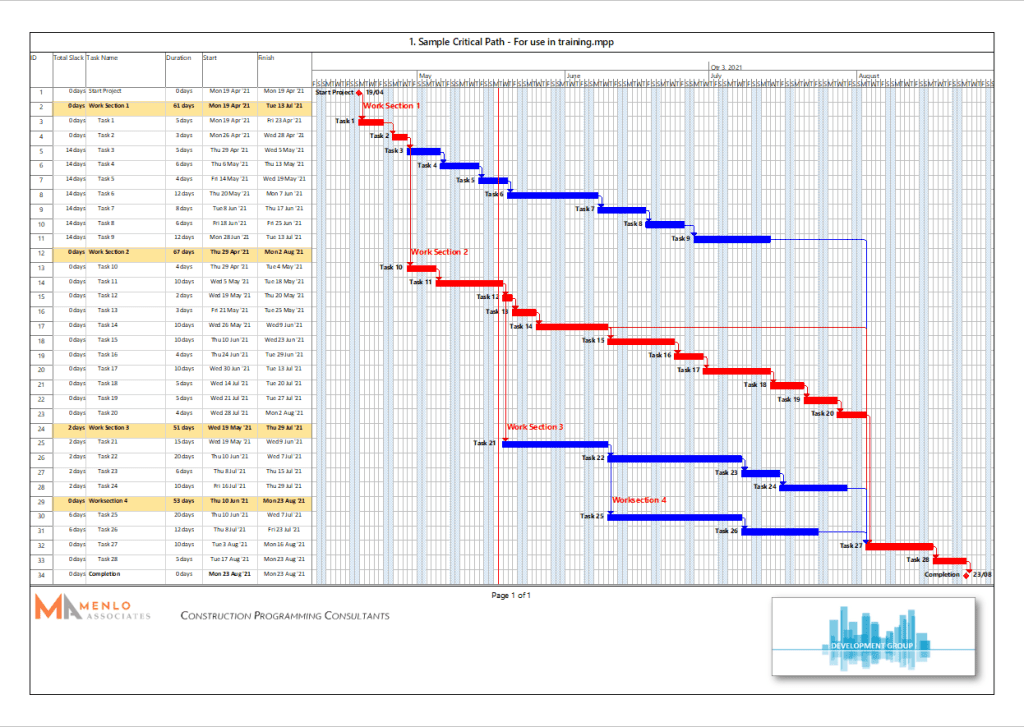
The next thing we need to do therefore is reduce the size by dragging the image handles smaller.
To do this you will first need to save the page setting dialogue and then reopen it. This will make the handles appear when you click the image.
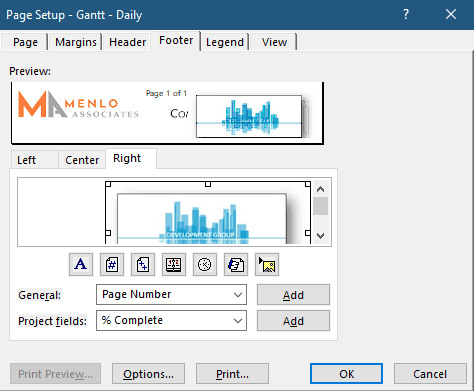
Once you have the image at a size you are happy with (use a little trial and error until the print preview looks good), then you can copy and paste the image back into Word.
You can then right click on the image and save as a picture (either png or jpg). This will now be saved as exactly the right size for your current and any future programmes.
Example:
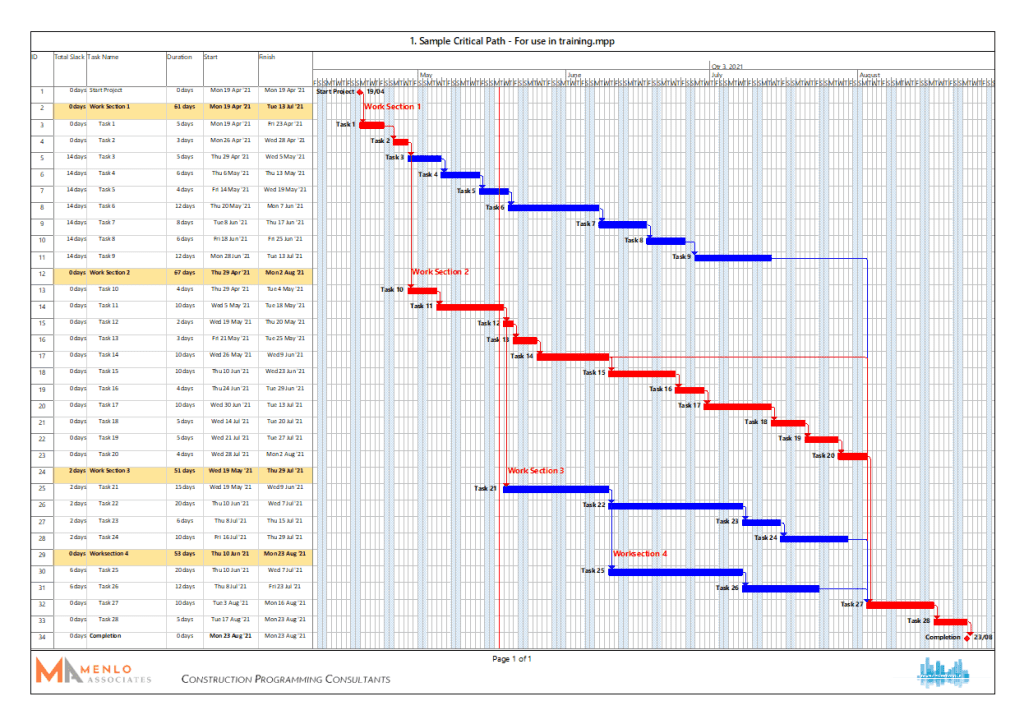

In this case my resulting Logo is 3.84cm (1.5 inches) wide by 1.96cm (0.77 inches) tall and will stay like this…
Perfect for inserting into my next Programme.
If you have any questions regarding MS Project, or construction programming, feel free to email at JustAsk@Menlo-Academy.com.
Many companies invest heavily in Plant & Equipment, so it naturally follows that having spent all that money, they will want to maximise the equipment’s use as efficiently as possible.
Sometimes though, keeping track of everything can be a bit like herding chickens, especially if you have a large inventory of equipment across multiple projects. Helpfully, Project can take the pain out of running this process and make life far easier for everyone by using Resource Pooling. A resource pool is a special Project file created specifically to contain only a list of common resources that are available for use across multiple Projects. It uses only the Resource Sheet (which is one of Project’s default views), to hold all relevant information on your global set of resources. As with any Project view, it can be customised with additional fields and columns to add additional information to suit your needs and requirements. Other than this, the Programme file is left empty.
So, let’s first set it up and then look at how we could use it, not only to track usage but also costs.
First, we need to create a new blank programme, then save it with a name that immediately identifies its purpose, such as ‘Resource Pool’ or similar.
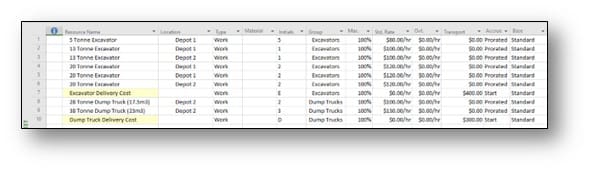
Resources are the people (labour), plant, materials, and services, which get consumed during the life of the project. For this example, I’m only going to concentrate on Plant, so here’s a sample list of resources that I have loaded on to the resource sheet as our commonly shared equipment.
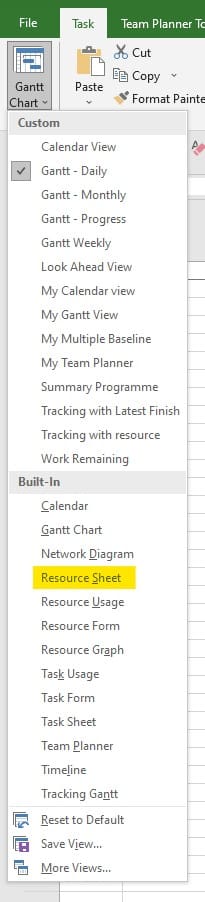
The way to access the Resource Sheet is to click on the Gantt chart icon at the top right corner of the Programme and choose from the drop-down list.
Task > Gantt Chart > Resource Sheet
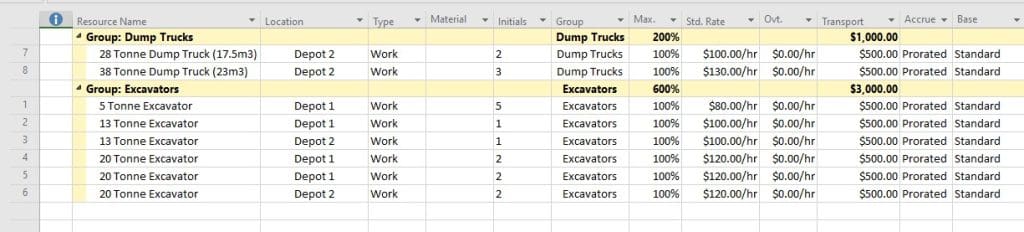
Once we have written up our list of resources, we can add additional useful information, such as charge out rate, and delivery transport costs or location if you have more than one depot. You can add additional columns as you see fit, to suit your needs.
In my example in the image below, I’ve added a custom column to show Location, this column is useful if plant is garaged in multiple Depots.
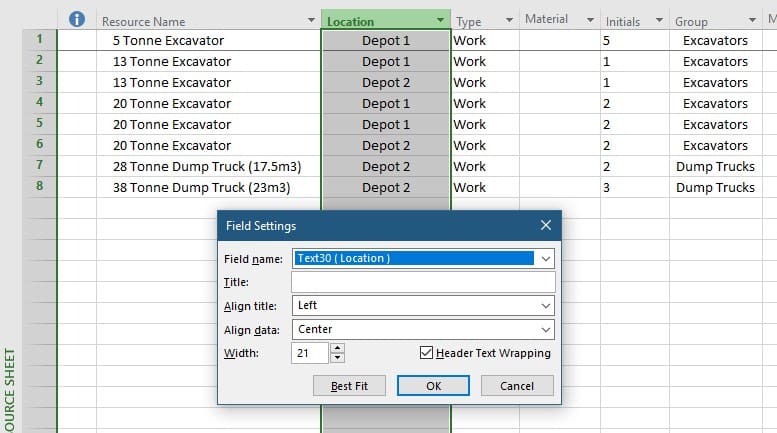
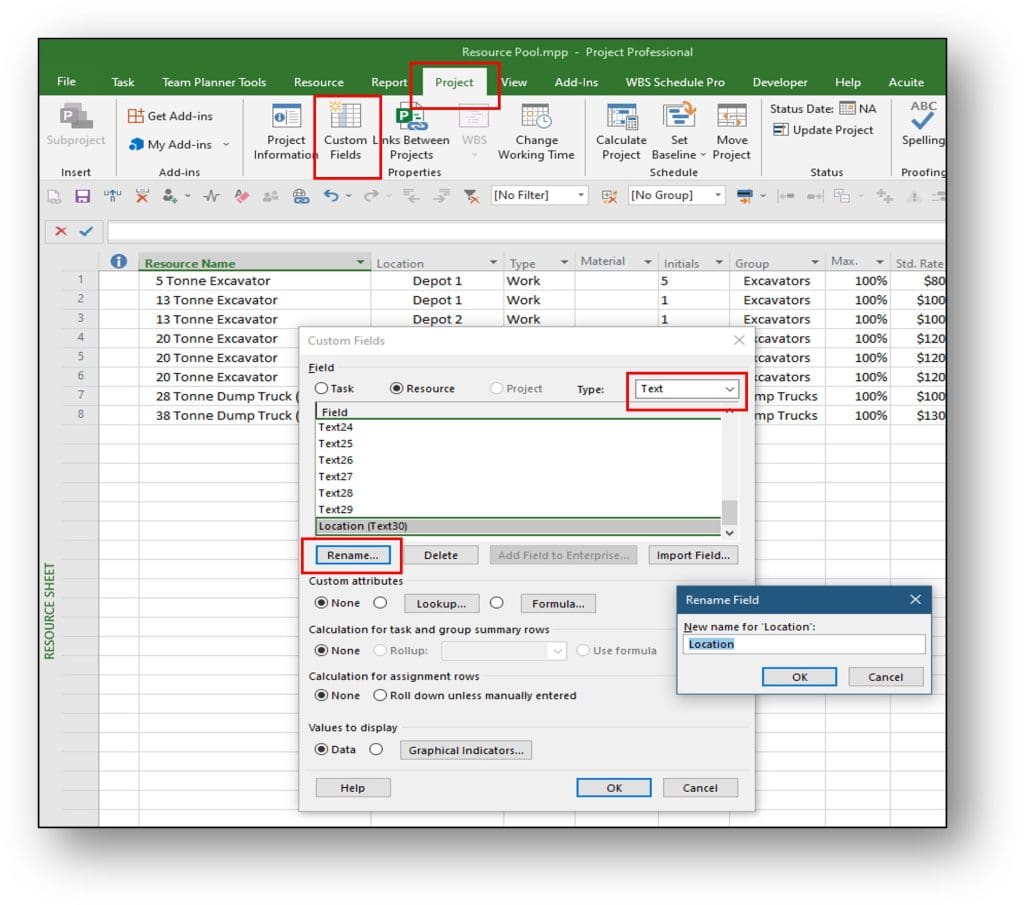
Project has a large number of customisable fields that you can set up how you want. I won’t go into this too deeply here, but the way set one up is to navigate to the Project Tab and click on Custom Fields. Choose the preferred Field Type, pick a field and rename it.
Project Tab > Custom Fields
In this example I’ve chosen Text 30:
It’s worth noting at this point that the custom fields available in the Resource Sheet view are different to the custom fields in the Gantt view. Text 1 in the resource sheet is not the same field as Text 1 in the Gantt view, the available options are specific to the view in use.
The next thing I’m going to do is add some charge out rates and Transport costs.
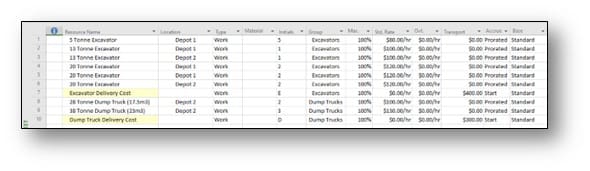
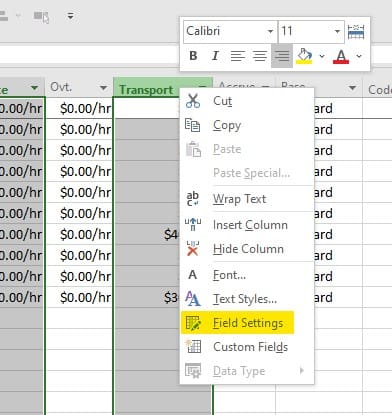
The Transport Cost column is actually a renaming of the default Cost Per Use column. The way to rename the column is through the Field Setting dialogue as follows:
Right-click on the column heading and choose Field Settings from the drop-down list.
Then in the Field Settings dialogue, type the new column name in the Title box, and click OK.
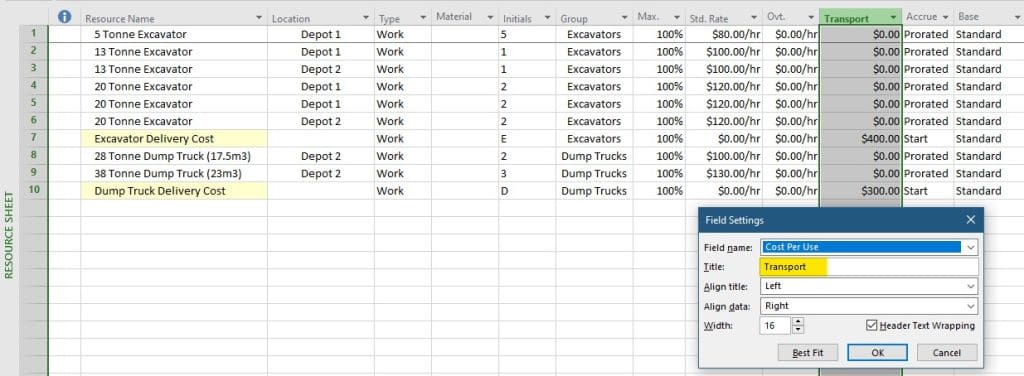
Costs can be calculated in one of 3 ways – at the start, at the end, or prorated as the work progresses.
In this example the charge rate for each machine is listed as a standard rate with the charge accrued prorated, whereas the delivery cost is made as a cost per use charged at the start. You could also, if you wanted to, add a disestablishment charge at the end of use, or for example, fuel costs charged progressively.
Before we move on to looking at how we share the resource pool with multiple projects, I just want to make you aware of another way of viewing the resource table, and that’s to use the Grouping Filter.
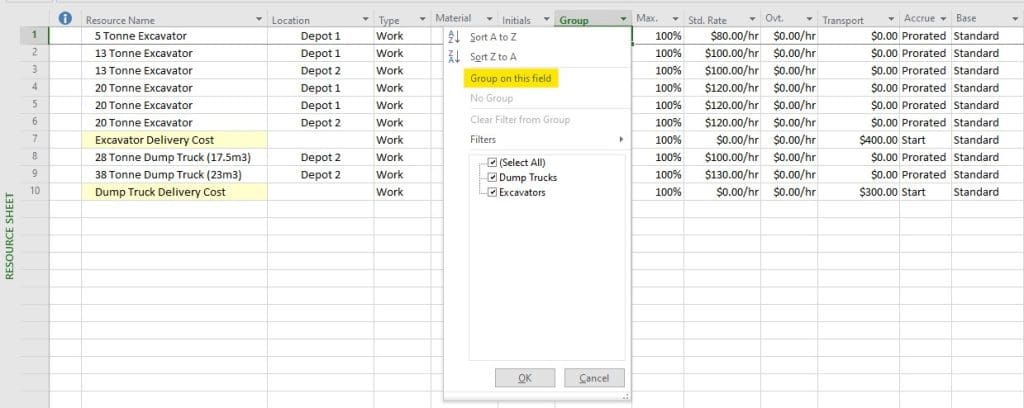
The view then changes to this organised looking view:
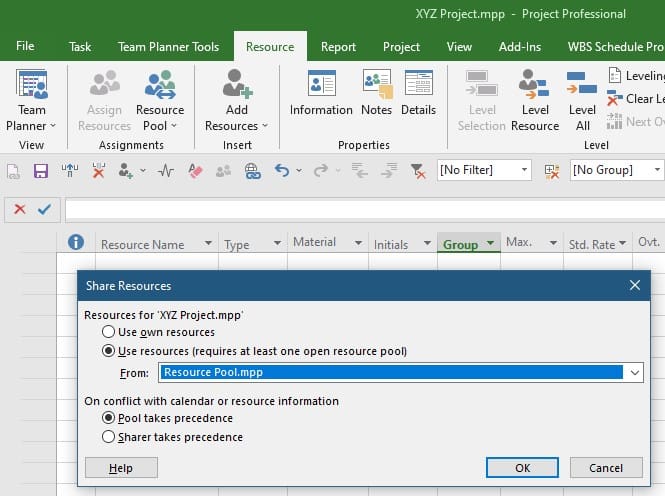
Open a project that you want to share the resource pool with. It can be a new or existing project, either with or without resources already allocated, and open the Resource Sheet view.
Resource Tab > Resource Pool
Note that any resources in the existing Project will automatically be shared with the Resource Pool too.
With the Resource Pool programme open, choose it in the drop-down to create the dynamic link. Click OK and the Resource Pool is now linked to your Project.
Before you link the Programmes consider the following:
The nature of the Resource Pool is that it acts as a server for all the linked Projects, updating resource changes to all Projects dynamically in real time. However, changes to resource usage are driven by events in the individual projects as work unfolds.
Consequently, the sharing is a two-way street, so that as resource use and availability changes, they ripple through and update all of the other projects in the network. As a result, the Resource Pool will pull the resources from all of the linked projects together and update the Pool to reflect all resources (labour, materials, and plant), across the whole network.
The downside of this is that it could lead to major confusion over what resources are serving what project. Especially where we have separate but matching resources across the group of connected projects.
For example, I have 2 Projects that I want to link to the resource Pool – Project ABC & Project XYZ. They will both utilise shared equipment in the Pool, however they will each also have their own unshared resources. Once they are linked to the Pool, all resources are visible to all Projects, so they need to be easily recognisable.
The easiest way I’ve found to manage this, and avoid any confusion, is to add a job code in front of the resources to identify the Project they relate to. So, before I link the Projects together, they all get identifier prefix codes.
Pool for the shared Pool items and ABC for the first programme and XYZ for the second - the code can be anything as long as it clearly identifies where each resource belongs.
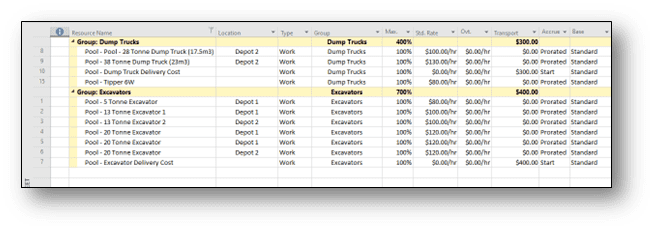
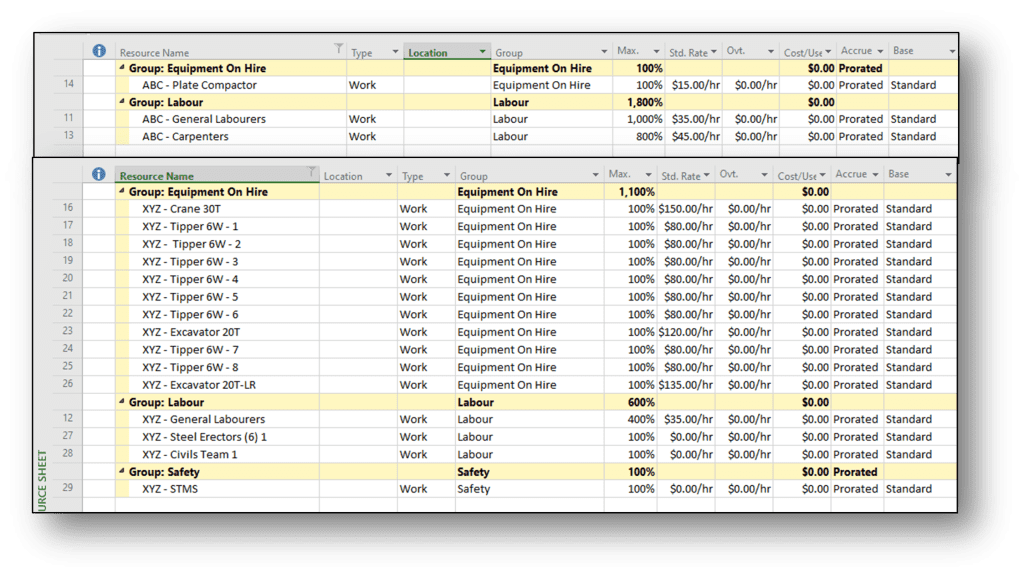
Now, when the programmes are linked, we see the following on the Resource Sheet:
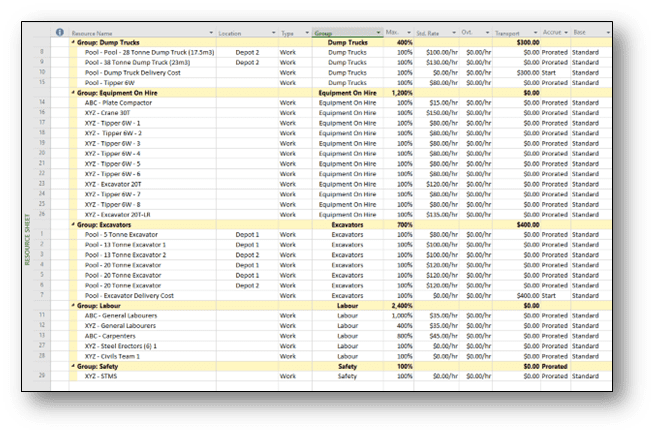
And when we are working on a Project it’s easy to see which resources are in the shared Pool and which are Project specific.
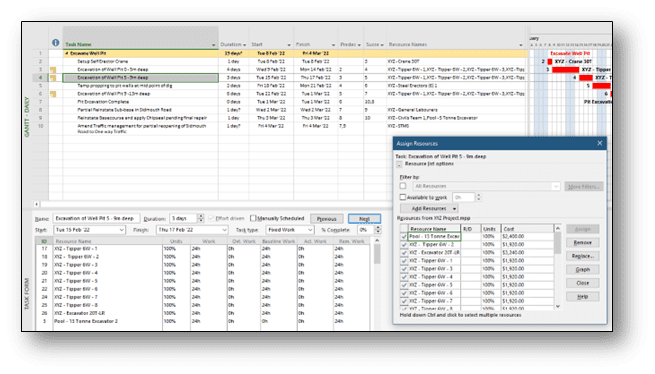
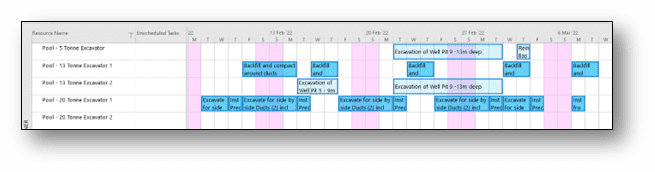
When optimising resources in the Team Planner view, any cross project over allocations are easily spotted as the Gantt bars for external project tasks show in a lighter shade. In the screenshot below, there is an over allocation (indicated by the red brackets) of 13 Tonne Excavator 1. It’s allocated to Backfill & Compact works on Project ABC shown by the dark blue bars, and at the same time it’s allocated to Excavation of Well Pit on Project XYZ.

Since 13 Tonne Excavator 2 is fully available at that time, the Well Pit work can be allocated to that machine instead, either by drag and drop or by right clicking and choosing Reassign from the dialogue.

The end result, the over allocation is resolved:
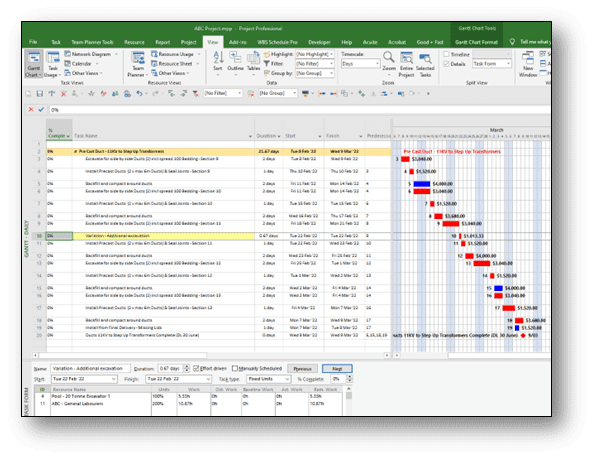
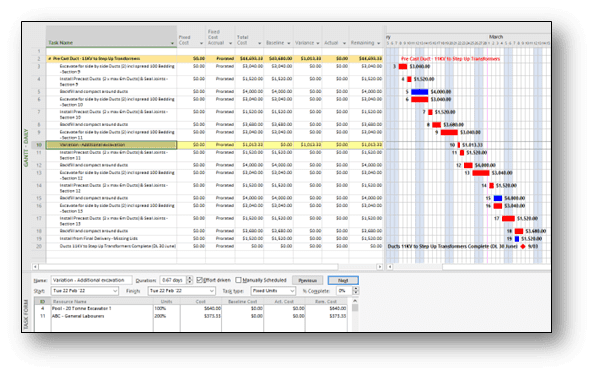
Having costs assigned to the resources makes it easy to track where the project is at financially, simply by changing the view. Views are set up as a series of Tables, the default view is for Task Entry, but often we need to know the cost to complete. This is shown by navigating to the View Tab in the menu ribbon, clicking on the Tables icon and choosing Cost from the dialogue.
View Tab > Tables >Cost
If you have any questions regarding pooled resources in Microsoft Project, or anything else, feel free to email at JustAsk@Menlo-Academy.com.
There are 3 pre-set Calendars available in Project…
The default is Standard (Project Calendar) - Daytime 8-hour shift between 8am & 5pm (allows for 1 hr. lunch break) and running for 5 days/wk. Mon – Fri.
The others are:
These are all basic set ups which you will need to further customise to your needs and requirements.
Generally, you will be using the Standard Calendar, and before programming any works, you should set up the Calendar with the working hours of your project and the public holidays and any other envisaged non-working time such as Christmas or summer shutdowns for at least the duration of the project plus 6 months beyond.
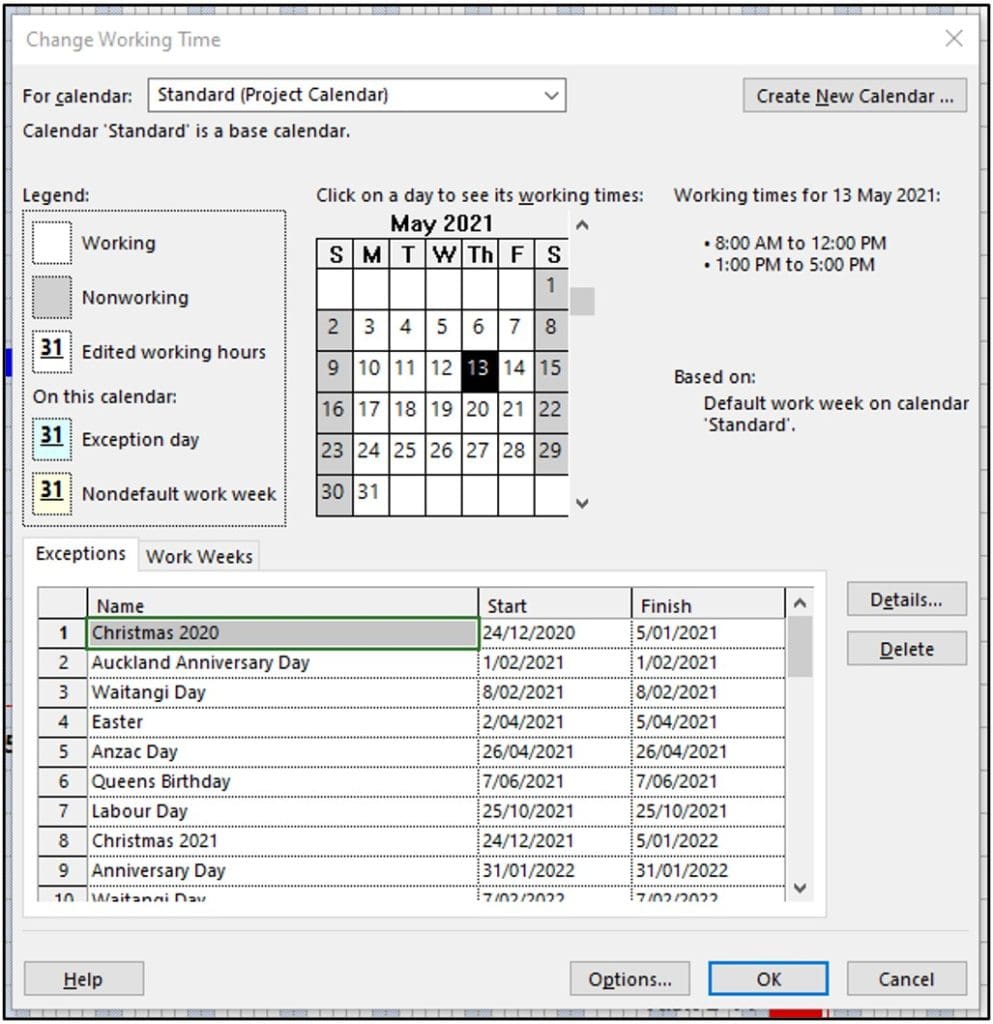
Note, Sat & Sun are already set as non-working time by default; but this can be changed as required.
Calendars are fully customisable. However, I would advise keeping the working day set to
8hrs when programming even if you intend to run the project at 9 or 10 hrs. per day.
This is because the majority of people tend to think in terms of an 8-hr day & 40 hr. week and confusion and miscommunication can creep in very easily when talking at cross purposes.
If you are working a 10-hour day, all that will happen is that you will complete works faster than planned. This is better than planning 4 days duration (4x10 hrs. work) and then having a subcontractor taking 5 days (5x8 hrs. work).
Once you have customised your default calendar you can save it to your Global Template so that it is preloaded into each new programme you create.
The Project Calendar is not the only Calendar that’s available to you. In addition to the Project Calendar, you can create any number of separate individual calendars which can be assigned either to individual Resources, or individual Tasks. However, the way they are applied in each case is different.
You can create and save a customised Resource Calendar for say a specific trade and then assign it to that resource. To assign it to the resource, go to the Resource Sheet view and there is a column called base calendar. You can then click and choose to set the required calendar in this column.

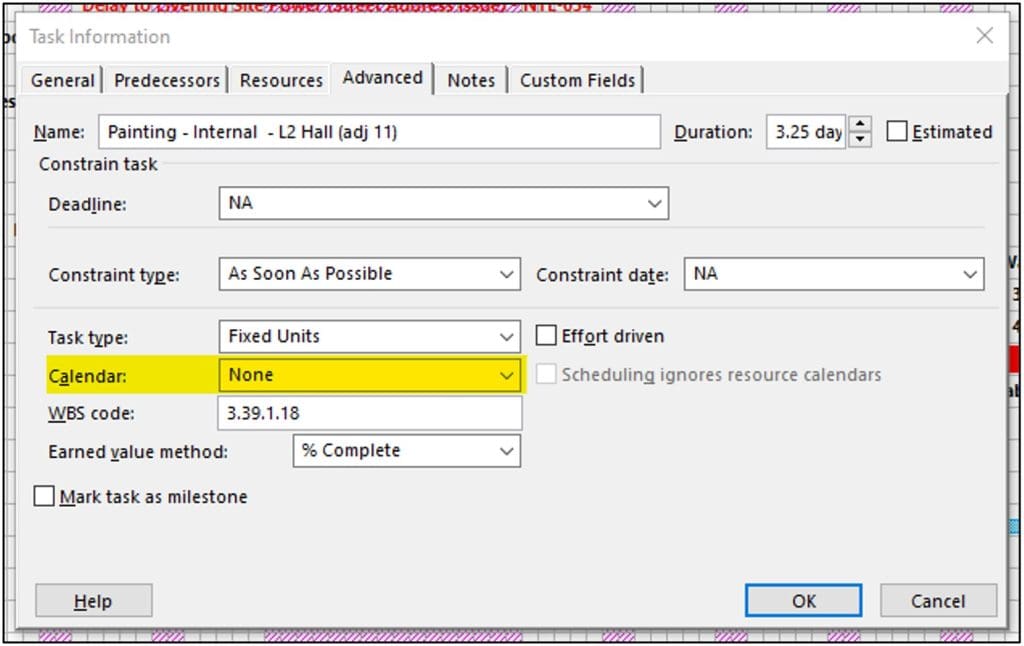
To assign a Task Calendar to a task, you can either use the information box for one or multiple selected tasks on the Advanced tab of the Task Information dialogue box, accessed by right click on a task and choose it from the drop-down list.
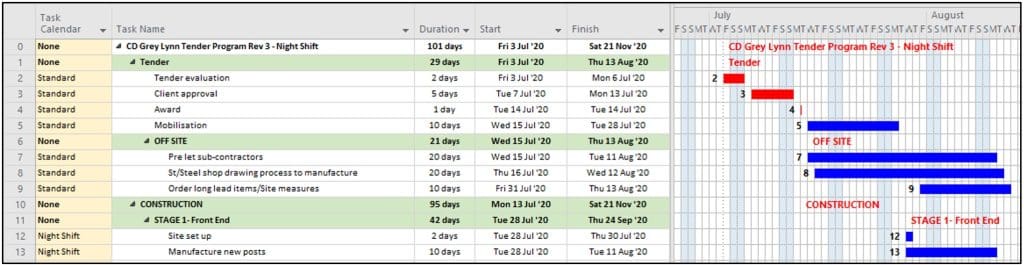
Or secondly for a more bulk approach, insert a column called Task Calendar onto your worksheet, right click on a column heading and choose insert column where you want it to show.
Just a few things to note about calendars:
Always set up your project calendar before you enter any tasks on a new programme - holidays working time etc.
Calendars have the following priority levels:
Other things to note when setting working times for calendars:
To change the working times on a Calendar, go to the Project Tab > Change Working Time.
And either create a new calendar or update an existing one by setting the required times. See below:
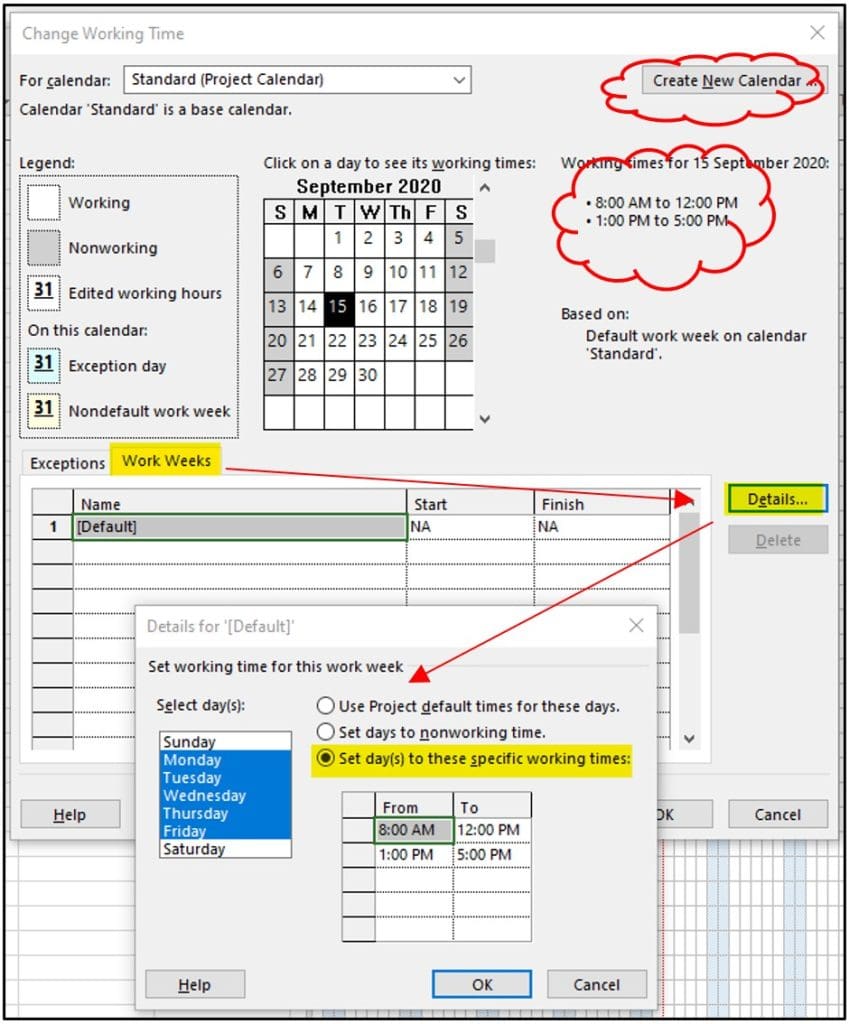
Note that the Default working times over-ride times set in the Project Calendar, so if you make changes there, you will need to coordinate the default start, finish, and hours to match, in the Project Options dialogue found under File > Options > Schedule.

Be aware, if you have multiple calendars in your programme, the one that will be displayed on your Gantt chart is generally the Standard Calendar.
If you want to display a different calendar you have to change the setting in the Non-working Time
tab in the Timescale dialogue box. This is accessed either by double clicking the Timescale at the top of the Gantt chart or double clicking on an area of non-working time on the Gantt chart itself.

If you have any questions regarding MS Project's calendars, or anything else, feel free to email at JustAsk@Menlo-Academy.com.
Preview and download the article below: